우분투에서 Prometheus, Grafana, 그리고 node-exporter를 설치하고 구성하는 방법
- Prometheus
- 시스템 모니터링 및 경고 : Prometheus는 다양한 서버 및 서비스의 지표(metric)를 수집하고 저장하는 역할을 합니다.
- 지속적인 스크래핑 : 설정된 주기로 서버 및 애플리케이션의 지표를 수집하여 저장합니다.
- Query 언어 : PromQL(Query Language)을 사용하여 저장된 데이터를 쿼리하고 분석할 수 있습니다.
- 경보 및 알림 기능: 설정한 임계값을 초과하는 경우 경고를 생성하고, 설정한 경보 수단으로 알림을 보낼 수 있습니다.
- Grafana
- 대시보드 및 시각화 : Grafana는 다양한 데이터 소스로부터 데이터를 가져와 대시보드를 생성하고 시각적으로 표현합니다.
- 다양한 플러그인 지원 : 다양한 데이터 소스에 대한 플러그인을 제공하여, Prometheus, InfluxDB, Elasticsearch 등과 같은 여러 데이터베이스와 통합이 가능합니다.
- 경보 및 알림 설정 : Grafana는 Prometheus로부터 받은 데이터를 기반으로 사용자가 정의한 임계값을 사용하여 경보 및 알림을 설정할 수 있습니다.
- node-exporter
- 호스트 지표 수집 : node-exporter는 호스트 시스템의 성능 및 리소스 사용량과 관련된 다양한 지표를 수집합니다.
- Prometheus에 데이터 제공 : 수집한 데이터를 Prometheus에 노출하여 Prometheus가 이를 수집하고 저장할 수 있도록 합니다.
- 가벼운 에이전트 : node-exporter는 가벼운 형태로 설치되며, 호스트 시스템의 부하를 최소화하면서도 중요한 성능 지표를 수집합니다.
Prometheus Download

Prometheus 시스템 그룹 및 사용자 생성
sudo groupadd --system prometheussudo useradd -s /sbin/nologin --system -g prometheus prometheusPrometheus 디렉토리 생성
sudo mkdir -p /etc/prometheus /var/lib/prometheusPrometheus 설치
Prometheus 다운로드
wget https://github.com/prometheus/prometheus/releases/download/v2.48.0/prometheus-2.48.0.linux-amd64.tar.gz압축 파일 풀기
tar -xvzf prometheus-2.30.0.linux-amd64.tar.gz압축 푼 디렉토리로 이동하기
cd prometheus-2.30.0.linux-amd64바이너리 파일을 bin(/usr/local/bin) 디렉토리로 복사
cp prometheus promtool /usr/local/bin/바이너리 파일의 소유권 변경
sudo chown prometheus:prometheus /usr/local/bin/prom*Prometheus 구성 파일 및 구성 디렉토리을 etc(/etc/prometheus/) 디렉토리로 복사
sudo cp -rf consoles console_libraries prometheus.yml /etc/prometheus/설정 파일 및 디렉토리의 소유권 변경
sudo chown -R prometheus:prometheus /etc/prometheus /var/lib/prometheusPrometheus 설정
Prometheus 구성 파일 확인
vim /etc/prometheus/prometheus.yml# my global config
global:
scrape_interval: 15s # Set the scrape interval to every 15 seconds. Default is every 1 minute.
evaluation_interval: 15s # Evaluate rules every 15 seconds. The default is every 1 minute.
# scrape_timeout is set to the global default (10s).
# Alertmanager configuration
alerting:
alertmanagers:
- static_configs:
- targets:
# - alertmanager:9093
# Load rules once and periodically evaluate them according to the global 'evaluation_interval'.
rule_files:
# - "first_rules.yml"
# - "second_rules.yml"
# A scrape configuration containing exactly one endpoint to scrape:
# Here it's Prometheus itself.
scrape_configs:
# The job name is added as a label `job=<job_name>` to any timeseries scraped from this config.
- job_name: "prometheus"
# metrics_path defaults to '/metrics'
# scheme defaults to 'http'.
static_configs:
- targets: ["localhost:9090"]Prometheus 서비스 파일 생성
sudo vim /etc/systemd/system/prometheus.service[Unit]
Description=Prometheus
Documentation=https://prometheus.io/docs/introduction/overview/
Wants=network-online.target
After=network-online.target
[Service]
User=prometheus
Group=prometheus
Type=simple
ExecReload=/bin/kill -HUP \$MAINPID
ExecStart=/usr/local/bin/prometheus \
--config.file /etc/prometheus/prometheus.yml \
--storage.tsdb.path /var/lib/prometheus/ \
--web.console.templates=/etc/prometheus/consoles \
--web.console.libraries=/etc/prometheus/console_libraries \
SyslogIdentifier=prometheus
Restart=always
[Install]
WantedBy=multi-user.targetSysemd 리로드
sudo systemctl daemon-reloadPrometheus 실행
sudo systemctl --now enable prometheusPrometheus 상태 확인
sudo systemctl status prometheussudo systemctl status prometheus --no-pager -lPrometheus를 위한 설정 파일 (prometheus.yml)을 작성하고 Prometheus를 다시 시작합니다.
vim /etc/prometheus/prometheus.ymlglobal:
scrape_interval: 15s
evaluation_interval: 15s
alerting:
alertmanagers:
- static_configs:
- targets:
# - alertmanager:9093
rule_files:
# - "first_rules.yml"
# - "second_rules.yml"
scrape_configs:
- job_name: 'prometheus'
static_configs:
- targets: ['localhost:9100']
- job_name: node_exporter
scrape_interval: 5s
static_configs:
- targets:
- 192.168.56.52:9100Prometheus를 다시 시작합니다.
sudo systemctl restart prometheus브라우저에서 http://localhost:9090 접속하여 확인
http://localhost:9090
2. Grafana 설치
Grafana 설치
sudo apt-get install -y grafanaGrafana 서비스 시작
sudo systemctl start grafana-server부팅 시 자동 시작 설정
sudo systemctl enable grafana-server브라우저에서 http://localhost:3000 접속하여 확인 (기본 로그인 정보는 admin/admin)
http://localhost:30003. node-exporter 설치
node_exporter 사용자 생성
useradd -m -s /bin/false node_exporternode-exporter 다운로드
wget https://github.com/prometheus/node_exporter/releases/download/v1.7.0/node_exporter-1.7.0.linux-amd64.tar.gz압축 해제
tar xfz node_exporter-1.7.0.linux-amd64.tar.gz디렉토리 이동
cd node_exporter-1.7.0.linux-amd64바이너리 파일 복사
sudo cp node_exporter /usr/local/bin/바이너리 파일 소유권 변경
sudo chown node_exporter:node_exporter /usr/local/bin/node_exporternode_exporter 서비스 파일 생성
sudo vim /etc/systemd/system/node_exporter.service[Unit]
Description=Prometheus Node Exporter
After=network-online.target
[Service]
User=node_exporter
Group=node_exporter
Type=simple
ExecStart=/usr/local/bin/node_exporter
[Install]
WantedBy=multi-user.targetsystemd 리로드
sudo systemctl daemon-reloadnode-exporter 실행
sudo systemctl --now enable node_exporternode-exporter 상태 확인
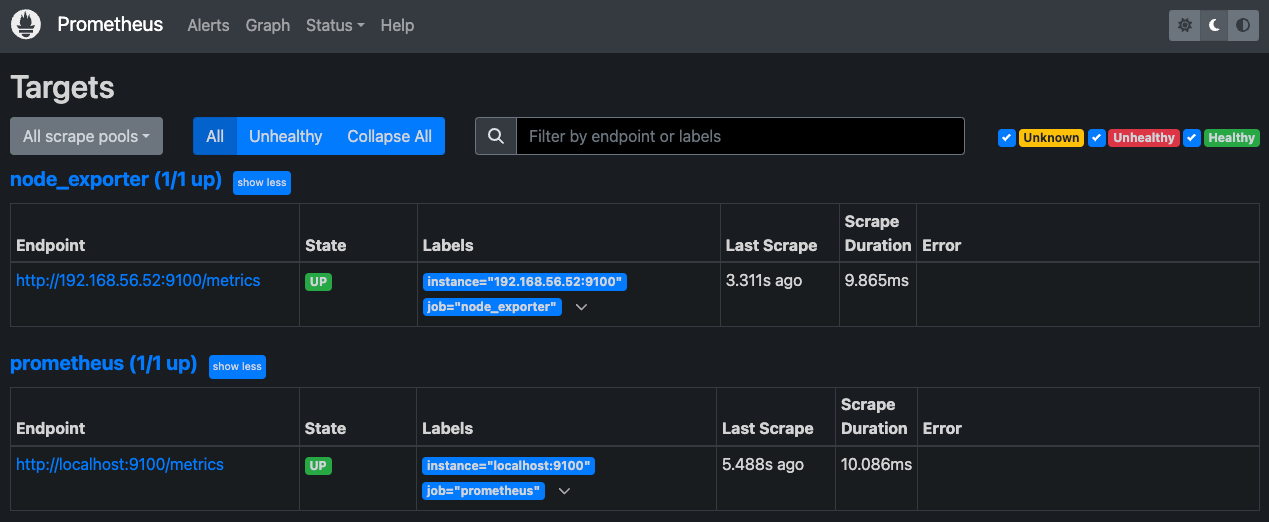
sudo systemctl status node_exportercurl 명령어를 통해 데이터가 성공적으로 수집되고 있는지 확인
curl http://localhost:9100/metricsPrometheus Targets
5. Grafana에 Prometheus 추가
- 브라우저에서 Grafana에 로그인합니다.
- 좌측 사이드바에서 "Configuration" -> "Data Sources"로 이동합니다.
- "Add your first data source"를 클릭하고, "Prometheus"를 선택합니다.
- HTTP 설정에서 URL에 http://localhost:9090 입력 후 "Save & Test"를 클릭하여 연결을 확인합니다.
6. 대시보드 만들기
- 좌측 사이드바에서 "+" 아이콘을 클릭하여 "Dashboard"를 선택합니다.
- "Add new panel"을 클릭하고, 데이터 소스로 "Prometheus"를 선택합니다.
- PromQL을 사용하여 원하는 지표를 추가하고 대시보드를 구성합니다.
이제 Prometheus, Grafana, 그리고 node-exporter가 함께 동작하며, 시스템 및 애플리케이션의 모니터링을 위한 환경이 구성되었습니다.
'리눅스' 카테고리의 다른 글
| Nginx에서 map 디렉티브를 사용하는 방법 (0) | 2023.12.05 |
|---|---|
| Grafana 대시보드를 가져오는 방법(Import dashboard) (0) | 2023.12.05 |
| 우분투에서 Grafana, InfluxDB 2, Telegraf를 설치하고 구성하는 방법 (0) | 2023.12.04 |
| 우분투에서 lsyncd를 사용하여 디렉토리 간에 변경 사항을 실시간으로 동기화하는 방법 (0) | 2023.12.01 |
| 리눅스에서 ulimit을 설정하는 방법 (0) | 2023.11.30 |


