728x90
Grafana 대시보드를 가져오는 방법(Import dashboard)
Grafana 대시보드를 JSON 파일을 사용하여 가져오는 방법입니다.
Grafana 대시보드 Download


Grafana Importing dashboards
더보기
---
{
"__inputs": [
{
"name": "DS_ZABBIX_FOURSYS",
"label": "",
"description": "",
"type": "datasource",
"pluginId": "alexanderzobnin-zabbix-datasource",
"pluginName": "Zabbix"
}
],
"__requires": [
{
"type": "datasource",
"id": "alexanderzobnin-zabbix-datasource",
"name": "Zabbix",
"version": "1.0.0"
},
{
"type": "grafana",
"id": "grafana",
"name": "Grafana",
"version": "4.1.1"
},
{
"type": "panel",
"id": "grafana-clock-panel",
"name": "Clock",
"version": "0.0.8"
},
{
"type": "panel",
"id": "graph",
"name": "Graph",
"version": ""
},
{
"type": "panel",
"id": "singlestat",
"name": "Singlestat",
"version": ""
}
],
"annotations": {
"list": []
},
"editable": true,
"gnetId": 1320,
"graphTooltip": 0,
"hideControls": false,
"id": null,
"links": [],
"refresh": "5s",
"rows": [
{
"collapse": false,
"height": 191,
"panels": [
{
"bgColor": null,
"clockType": "24 hour",
"countdownSettings": {
"endCountdownTime": "2017-01-15T11:55:00.000Z",
"endText": "00:00:00"
},
"dateSettings": {
"dateFormat": "DD-MM-YYYY",
"fontSize": "20px",
"fontWeight": "normal",
"showDate": true
},
"id": 1,
"links": [],
"mode": "time",
"offsetFromUtc": null,
"offsetFromUtcMinutes": null,
"span": 4,
"timeSettings": {
"customFormat": "HH:mm:ss",
"fontSize": "60px",
"fontWeight": "normal"
},
"title": "",
"type": "grafana-clock-panel"
},
{
"cacheTimeout": null,
"colorBackground": false,
"colorValue": true,
"colors": [
"rgba(50, 172, 45, 0.97)",
"rgb(18, 251, 0)",
"rgba(245, 54, 54, 0.9)"
],
"datasource": "${DS_ZABBIX_FOURSYS}",
"format": "none",
"gauge": {
"maxValue": 100,
"minValue": 0,
"show": false,
"thresholdLabels": false,
"thresholdMarkers": true
},
"id": 3,
"interval": null,
"links": [],
"mappingType": 1,
"mappingTypes": [
{
"name": "value to text",
"value": 1
},
{
"name": "range to text",
"value": 2
}
],
"maxDataPoints": 100,
"nullPointMode": "connected",
"nullText": null,
"postfix": "",
"postfixFontSize": "50%",
"prefix": "",
"prefixFontSize": "50%",
"rangeMaps": [
{
"from": "null",
"text": "N/A",
"to": "null"
}
],
"span": 2,
"sparkline": {
"fillColor": "rgba(31, 118, 189, 0.18)",
"full": false,
"lineColor": "rgb(31, 120, 193)",
"show": false
},
"targets": [
{
"application": {
"filter": "ICMP"
},
"functions": [],
"group": {
"filter": "$Grupo"
},
"host": {
"filter": "$Hosts"
},
"item": {
"filter": "Disponibilidade"
},
"mode": 0,
"options": {
"showDisabledItems": false
},
"refId": "A"
}
],
"thresholds": "",
"title": "Disponibilidade",
"type": "singlestat",
"valueFontSize": "80%",
"valueMaps": [
{
"op": "=",
"text": "DOWN",
"value": "0"
},
{
"op": "=",
"text": "UP",
"value": "1"
}
],
"valueName": "current"
},
{
"cacheTimeout": null,
"colorBackground": false,
"colorValue": true,
"colors": [
"rgba(50, 172, 45, 0.97)",
"rgb(18, 251, 0)",
"rgba(245, 54, 54, 0.9)"
],
"datasource": "${DS_ZABBIX_FOURSYS}",
"decimals": 2,
"format": "ms",
"gauge": {
"maxValue": 100,
"minValue": 0,
"show": false,
"thresholdLabels": false,
"thresholdMarkers": true
},
"id": 8,
"interval": null,
"links": [],
"mappingType": 1,
"mappingTypes": [
{
"name": "value to text",
"value": 1
},
{
"name": "range to text",
"value": 2
}
],
"maxDataPoints": 100,
"nullPointMode": "connected",
"nullText": null,
"postfix": "",
"postfixFontSize": "50%",
"prefix": "",
"prefixFontSize": "50%",
"rangeMaps": [
{
"from": "null",
"text": "N/A",
"to": "null"
}
],
"span": 2,
"sparkline": {
"fillColor": "rgba(31, 118, 189, 0.18)",
"full": false,
"lineColor": "rgb(31, 120, 193)",
"show": false
},
"targets": [
{
"application": {
"filter": "ICMP"
},
"functions": [],
"group": {
"filter": "$Grupo"
},
"host": {
"filter": "$Hosts"
},
"item": {
"filter": "Tempo de Resposta"
},
"mode": 0,
"options": {
"showDisabledItems": false
},
"refId": "A"
}
],
"thresholds": "",
"title": "Latência de Rede",
"type": "singlestat",
"valueFontSize": "80%",
"valueMaps": [],
"valueName": "current"
},
{
"cacheTimeout": null,
"colorBackground": false,
"colorValue": true,
"colors": [
"rgba(50, 172, 45, 0.97)",
"rgb(18, 251, 0)",
"rgba(245, 54, 54, 0.9)"
],
"datasource": "${DS_ZABBIX_FOURSYS}",
"decimals": 3,
"format": "pps",
"gauge": {
"maxValue": 100,
"minValue": 0,
"show": false,
"thresholdLabels": false,
"thresholdMarkers": true
},
"id": 10,
"interval": null,
"links": [],
"mappingType": 1,
"mappingTypes": [
{
"name": "value to text",
"value": 1
},
{
"name": "range to text",
"value": 2
}
],
"maxDataPoints": 100,
"nullPointMode": "connected",
"nullText": null,
"postfix": "",
"postfixFontSize": "50%",
"prefix": "",
"prefixFontSize": "50%",
"rangeMaps": [
{
"from": "null",
"text": "N/A",
"to": "null"
}
],
"span": 2,
"sparkline": {
"fillColor": "rgba(31, 118, 189, 0.18)",
"full": false,
"lineColor": "rgb(31, 120, 193)",
"show": false
},
"targets": [
{
"application": {
"filter": "ICMP"
},
"functions": [],
"group": {
"filter": "$Grupo"
},
"host": {
"filter": "$Hosts"
},
"item": {
"filter": "Perda de Pacotes"
},
"mode": 0,
"options": {
"showDisabledItems": false
},
"refId": "A"
}
],
"thresholds": "",
"title": "Perda de Pacotes",
"type": "singlestat",
"valueFontSize": "80%",
"valueMaps": [],
"valueName": "current"
},
{
"cacheTimeout": null,
"colorBackground": false,
"colorValue": true,
"colors": [
"rgba(50, 172, 45, 0.97)",
"rgb(18, 251, 0)",
"rgba(245, 54, 54, 0.9)"
],
"datasource": "${DS_ZABBIX_FOURSYS}",
"decimals": 0,
"format": "s",
"gauge": {
"maxValue": 100,
"minValue": 0,
"show": false,
"thresholdLabels": false,
"thresholdMarkers": true
},
"id": 2,
"interval": null,
"links": [],
"mappingType": 1,
"mappingTypes": [
{
"name": "value to text",
"value": 1
},
{
"name": "range to text",
"value": 2
}
],
"maxDataPoints": 100,
"nullPointMode": "connected",
"nullText": null,
"postfix": "",
"postfixFontSize": "50%",
"prefix": "",
"prefixFontSize": "50%",
"rangeMaps": [
{
"from": "null",
"text": "N/A",
"to": "null"
}
],
"span": 2,
"sparkline": {
"fillColor": "rgba(31, 118, 189, 0.18)",
"full": false,
"lineColor": "rgb(31, 120, 193)",
"show": false
},
"targets": [
{
"application": {
"filter": "Sistema"
},
"functions": [],
"group": {
"filter": "$Grupo"
},
"host": {
"filter": "$Hosts"
},
"item": {
"filter": "Uptime"
},
"mode": 0,
"options": {
"showDisabledItems": false
},
"refId": "A"
}
],
"thresholds": "",
"title": "Uptime",
"type": "singlestat",
"valueFontSize": "80%",
"valueMaps": [
{
"op": "=",
"text": "",
"value": ""
},
{
"op": "=",
"text": "",
"value": ""
}
],
"valueName": "current"
}
],
"repeat": null,
"repeatIteration": null,
"repeatRowId": null,
"showTitle": false,
"title": "Dashboard Row",
"titleSize": "h6"
},
{
"collapse": false,
"height": 181,
"panels": [
{
"cacheTimeout": null,
"colorBackground": false,
"colorValue": false,
"colors": [
"rgba(50, 172, 45, 0.97)",
"rgba(237, 129, 40, 0.89)",
"rgba(245, 54, 54, 0.9)"
],
"datasource": "${DS_ZABBIX_FOURSYS}",
"format": "percent",
"gauge": {
"maxValue": 100,
"minValue": 0,
"show": true,
"thresholdLabels": false,
"thresholdMarkers": true
},
"id": 4,
"interval": null,
"links": [],
"mappingType": 1,
"mappingTypes": [
{
"name": "value to text",
"value": 1
},
{
"name": "range to text",
"value": 2
}
],
"maxDataPoints": 100,
"nullPointMode": "connected",
"nullText": null,
"postfix": "",
"postfixFontSize": "50%",
"prefix": "",
"prefixFontSize": "50%",
"rangeMaps": [
{
"from": "null",
"text": "N/A",
"to": "null"
}
],
"span": 2,
"sparkline": {
"fillColor": "rgba(31, 118, 189, 0.18)",
"full": false,
"lineColor": "rgb(31, 120, 193)",
"show": false
},
"targets": [
{
"application": {
"filter": "CPU"
},
"functions": [],
"group": {
"filter": "$Grupo"
},
"host": {
"filter": "$Hosts"
},
"item": {
"filter": "Uso de CPU %"
},
"mode": 0,
"options": {
"showDisabledItems": false
},
"refId": "A"
}
],
"thresholds": "95",
"title": "Uso de CPU %",
"type": "singlestat",
"valueFontSize": "80%",
"valueMaps": [
{
"op": "=",
"text": "N/A",
"value": "null"
}
],
"valueName": "current"
},
{
"cacheTimeout": null,
"colorBackground": false,
"colorValue": false,
"colors": [
"rgba(245, 54, 54, 0.9)",
"rgba(237, 129, 40, 0.89)",
"rgba(50, 172, 45, 0.97)"
],
"datasource": "${DS_ZABBIX_FOURSYS}",
"decimals": 2,
"format": "short",
"gauge": {
"maxValue": 100,
"minValue": 0,
"show": true,
"thresholdLabels": false,
"thresholdMarkers": true
},
"id": 7,
"interval": null,
"links": [],
"mappingType": 1,
"mappingTypes": [
{
"name": "value to text",
"value": 1
},
{
"name": "range to text",
"value": 2
}
],
"maxDataPoints": 100,
"nullPointMode": "connected",
"nullText": null,
"postfix": "",
"postfixFontSize": "50%",
"prefix": "",
"prefixFontSize": "50%",
"rangeMaps": [
{
"from": "null",
"text": "N/A",
"to": "null"
}
],
"span": 2,
"sparkline": {
"fillColor": "rgba(31, 118, 189, 0.18)",
"full": false,
"lineColor": "rgb(31, 120, 193)",
"show": false
},
"targets": [
{
"application": {
"filter": "CPU"
},
"functions": [],
"group": {
"filter": "$Grupo"
},
"host": {
"filter": "$Hosts"
},
"item": {
"filter": "Carga de sistema (média de 1 min por processador)"
},
"mode": 0,
"options": {
"showDisabledItems": false
},
"refId": "A"
}
],
"thresholds": "",
"title": "Carga do sistema",
"type": "singlestat",
"valueFontSize": "80%",
"valueMaps": [
{
"op": "=",
"text": "N/A",
"value": "null"
}
],
"valueName": "current"
},
{
"cacheTimeout": null,
"colorBackground": false,
"colorValue": false,
"colors": [
"rgba(50, 172, 45, 0.97)",
"rgba(237, 129, 40, 0.89)",
"rgba(245, 54, 54, 0.9)"
],
"datasource": "${DS_ZABBIX_FOURSYS}",
"format": "percent",
"gauge": {
"maxValue": 100,
"minValue": 0,
"show": true,
"thresholdLabels": false,
"thresholdMarkers": true
},
"id": 5,
"interval": null,
"links": [],
"mappingType": 1,
"mappingTypes": [
{
"name": "value to text",
"value": 1
},
{
"name": "range to text",
"value": 2
}
],
"maxDataPoints": 100,
"nullPointMode": "connected",
"nullText": null,
"postfix": "",
"postfixFontSize": "50%",
"prefix": "",
"prefixFontSize": "50%",
"rangeMaps": [
{
"from": "null",
"text": "N/A",
"to": "null"
}
],
"span": 2,
"sparkline": {
"fillColor": "rgba(31, 118, 189, 0.18)",
"full": false,
"lineColor": "rgb(31, 120, 193)",
"show": false
},
"targets": [
{
"application": {
"filter": "Memória"
},
"functions": [],
"group": {
"filter": "$Grupo"
},
"host": {
"filter": "$Hosts"
},
"item": {
"filter": "Uso de memória %"
},
"mode": 0,
"options": {
"showDisabledItems": false
},
"refId": "A"
}
],
"thresholds": "95",
"title": "Uso de memória %",
"type": "singlestat",
"valueFontSize": "80%",
"valueMaps": [
{
"op": "=",
"text": "N/A",
"value": "null"
}
],
"valueName": "current"
},
{
"cacheTimeout": null,
"colorBackground": false,
"colorValue": false,
"colors": [
"rgba(245, 54, 54, 0.9)",
"rgba(237, 129, 40, 0.89)",
"rgba(50, 172, 45, 0.97)"
],
"datasource": "${DS_ZABBIX_FOURSYS}",
"format": "percent",
"gauge": {
"maxValue": 100,
"minValue": 0,
"show": true,
"thresholdLabels": false,
"thresholdMarkers": true
},
"id": 11,
"interval": null,
"links": [],
"mappingType": 1,
"mappingTypes": [
{
"name": "value to text",
"value": 1
},
{
"name": "range to text",
"value": 2
}
],
"maxDataPoints": 100,
"nullPointMode": "connected",
"nullText": null,
"postfix": "",
"postfixFontSize": "50%",
"prefix": "",
"prefixFontSize": "50%",
"rangeMaps": [
{
"from": "null",
"text": "N/A",
"to": "null"
}
],
"span": 2,
"sparkline": {
"fillColor": "rgba(31, 118, 189, 0.18)",
"full": false,
"lineColor": "rgb(31, 120, 193)",
"show": false
},
"targets": [
{
"application": {
"filter": "Memória"
},
"functions": [],
"group": {
"filter": "$Grupo"
},
"host": {
"filter": "$Hosts"
},
"item": {
"filter": "Memória Swap Livre %"
},
"mode": 0,
"options": {
"showDisabledItems": false
},
"refId": "A"
}
],
"thresholds": "30",
"title": "Memória Swap Livre %",
"type": "singlestat",
"valueFontSize": "80%",
"valueMaps": [
{
"op": "=",
"text": "N/A",
"value": "null"
}
],
"valueName": "current"
},
{
"cacheTimeout": null,
"colorBackground": false,
"colorValue": false,
"colors": [
"rgba(50, 172, 45, 0.97)",
"rgba(237, 129, 40, 0.89)",
"rgba(245, 54, 54, 0.9)"
],
"datasource": "${DS_ZABBIX_FOURSYS}",
"format": "percent",
"gauge": {
"maxValue": 100,
"minValue": 0,
"show": true,
"thresholdLabels": false,
"thresholdMarkers": true
},
"id": 6,
"interval": null,
"links": [],
"mappingType": 1,
"mappingTypes": [
{
"name": "value to text",
"value": 1
},
{
"name": "range to text",
"value": 2
}
],
"maxDataPoints": 100,
"nullPointMode": "connected",
"nullText": null,
"postfix": "",
"postfixFontSize": "50%",
"prefix": "",
"prefixFontSize": "50%",
"rangeMaps": [
{
"from": "null",
"text": "N/A",
"to": "null"
}
],
"span": 2,
"sparkline": {
"fillColor": "rgba(31, 118, 189, 0.18)",
"full": false,
"lineColor": "rgb(31, 120, 193)",
"show": false
},
"targets": [
{
"application": {
"filter": "Memória"
},
"functions": [],
"group": {
"filter": "$Grupo"
},
"host": {
"filter": "$Hosts"
},
"item": {
"filter": "Uso do cache %"
},
"mode": 0,
"options": {
"showDisabledItems": false
},
"refId": "A"
}
],
"thresholds": "75",
"title": "Uso do cache %",
"type": "singlestat",
"valueFontSize": "80%",
"valueMaps": [
{
"op": "=",
"text": "N/A",
"value": "null"
}
],
"valueName": "current"
},
{
"cacheTimeout": null,
"colorBackground": false,
"colorValue": false,
"colors": [
"rgba(245, 54, 54, 0.9)",
"rgba(237, 129, 40, 0.89)",
"rgba(50, 172, 45, 0.97)"
],
"datasource": "${DS_ZABBIX_FOURSYS}",
"format": "short",
"gauge": {
"maxValue": 300,
"minValue": 100,
"show": true,
"thresholdLabels": false,
"thresholdMarkers": true
},
"id": 14,
"interval": null,
"links": [],
"mappingType": 1,
"mappingTypes": [
{
"name": "value to text",
"value": 1
},
{
"name": "range to text",
"value": 2
}
],
"maxDataPoints": 100,
"nullPointMode": "connected",
"nullText": null,
"postfix": "",
"postfixFontSize": "50%",
"prefix": "",
"prefixFontSize": "50%",
"rangeMaps": [
{
"from": "null",
"text": "N/A",
"to": "null"
}
],
"span": 1,
"sparkline": {
"fillColor": "rgba(31, 118, 189, 0.18)",
"full": false,
"lineColor": "rgb(31, 120, 193)",
"show": false
},
"targets": [
{
"application": {
"filter": "Processos"
},
"functions": [],
"group": {
"filter": "$Grupo"
},
"host": {
"filter": "$Hosts"
},
"item": {
"filter": "Número de processos"
},
"mode": 0,
"options": {
"showDisabledItems": false
},
"refId": "A"
}
],
"thresholds": "",
"title": "Número de processos",
"type": "singlestat",
"valueFontSize": "80%",
"valueMaps": [
{
"op": "=",
"text": "N/A",
"value": "null"
}
],
"valueName": "current"
},
{
"cacheTimeout": null,
"colorBackground": false,
"colorValue": false,
"colors": [
"rgba(50, 172, 45, 0.97)",
"rgba(237, 129, 40, 0.89)",
"rgba(245, 54, 54, 0.9)"
],
"datasource": "${DS_ZABBIX_FOURSYS}",
"format": "none",
"gauge": {
"maxValue": 100,
"minValue": 0,
"show": true,
"thresholdLabels": false,
"thresholdMarkers": true
},
"id": 13,
"interval": null,
"links": [],
"mappingType": 1,
"mappingTypes": [
{
"name": "value to text",
"value": 1
},
{
"name": "range to text",
"value": 2
}
],
"maxDataPoints": 100,
"nullPointMode": "connected",
"nullText": null,
"postfix": "",
"postfixFontSize": "50%",
"prefix": "",
"prefixFontSize": "50%",
"rangeMaps": [
{
"from": "null",
"text": "N/A",
"to": "null"
}
],
"span": 1,
"sparkline": {
"fillColor": "rgba(31, 118, 189, 0.18)",
"full": false,
"lineColor": "rgb(31, 120, 193)",
"show": false
},
"targets": [
{
"application": {
"filter": "Processos"
},
"functions": [],
"group": {
"filter": "$Grupo"
},
"host": {
"filter": "$Hosts"
},
"item": {
"filter": "Número de processos executando"
},
"mode": 0,
"options": {
"showDisabledItems": false
},
"refId": "A"
}
],
"thresholds": "100",
"title": "Processos executando",
"type": "singlestat",
"valueFontSize": "80%",
"valueMaps": [
{
"op": "=",
"text": "N/A",
"value": "null"
}
],
"valueName": "current"
}
],
"repeat": null,
"repeatIteration": null,
"repeatRowId": null,
"showTitle": false,
"title": "Dashboard Row",
"titleSize": "h6"
},
{
"collapse": false,
"height": 250,
"panels": [
{
"aliasColors": {
"Espaço livre na partição C: % (pfree)": "#629E51",
"Espaço livre na partição D: % (pfree)": "#E5AC0E"
},
"bars": false,
"datasource": "${DS_ZABBIX_FOURSYS}",
"fill": 5,
"id": 9,
"legend": {
"alignAsTable": false,
"avg": false,
"current": true,
"max": false,
"min": false,
"rightSide": false,
"show": true,
"total": false,
"values": true
},
"lines": true,
"linewidth": 1,
"links": [],
"nullPointMode": "null as zero",
"percentage": false,
"pointradius": 5,
"points": true,
"renderer": "flot",
"seriesOverrides": [],
"span": 12,
"stack": false,
"steppedLine": false,
"targets": [
{
"application": {
"filter": "Disco"
},
"functions": [],
"group": {
"filter": "$Grupo"
},
"host": {
"filter": "$Hosts"
},
"item": {
"filter": "/.*%/"
},
"mode": 0,
"options": {
"showDisabledItems": false
},
"refId": "A"
}
],
"thresholds": [
{
"colorMode": "critical",
"fill": true,
"line": true,
"op": "gt",
"value": 10
}
],
"timeFrom": null,
"timeShift": null,
"title": "$Hosts - Espaço Livre em Disco",
"tooltip": {
"shared": true,
"sort": 0,
"value_type": "individual"
},
"type": "graph",
"xaxis": {
"mode": "time",
"name": null,
"show": true,
"values": []
},
"yaxes": [
{
"format": "percent",
"label": null,
"logBase": 1,
"max": null,
"min": null,
"show": true
},
{
"format": "short",
"label": null,
"logBase": 1,
"max": null,
"min": null,
"show": true
}
]
}
],
"repeat": null,
"repeatIteration": null,
"repeatRowId": null,
"showTitle": false,
"title": "Dashboard Row",
"titleSize": "h6"
}
],
"schemaVersion": 14,
"style": "dark",
"tags": [],
"templating": {
"list": [
{
"allValue": null,
"current": {},
"datasource": "${DS_ZABBIX_FOURSYS}",
"hide": 0,
"includeAll": false,
"label": null,
"multi": false,
"name": "Grupo",
"options": [],
"query": "Servidores Linux",
"refresh": 1,
"regex": "",
"sort": 0,
"tagValuesQuery": "",
"tags": [],
"tagsQuery": "",
"type": "query",
"useTags": false
},
{
"allValue": null,
"current": {},
"datasource": "${DS_ZABBIX_FOURSYS}",
"hide": 0,
"includeAll": false,
"label": null,
"multi": false,
"name": "Hosts",
"options": [],
"query": "$Grupo.*",
"refresh": 1,
"regex": "",
"sort": 0,
"tagValuesQuery": "",
"tags": [],
"tagsQuery": "",
"type": "query",
"useTags": false
}
]
},
"time": {
"from": "2017-01-16T13:05:32.615Z",
"to": "2017-01-16T15:05:32.615Z"
},
"timepicker": {
"refresh_intervals": [
"5s",
"10s",
"30s",
"1m",
"5m",
"15m",
"30m",
"1h",
"2h",
"1d"
],
"time_options": [
"5m",
"15m",
"1h",
"6h",
"12h",
"24h",
"2d",
"7d",
"30d"
]
},
"timezone": "utc",
"title": "Dashboard Servers Linux",
"version": 15,
"description": "Dashboard baseado em informações coletadas em ambiente Linux;\r\nNeste Dashboard, criei um Templating, onde através do Grupo selecionado é possível alterar os hosts e obter informações automáticas."
}---
728x90
Grafana 대시보드 가져오기
1. Grafana 대시보드 홈으로 이동합니다.
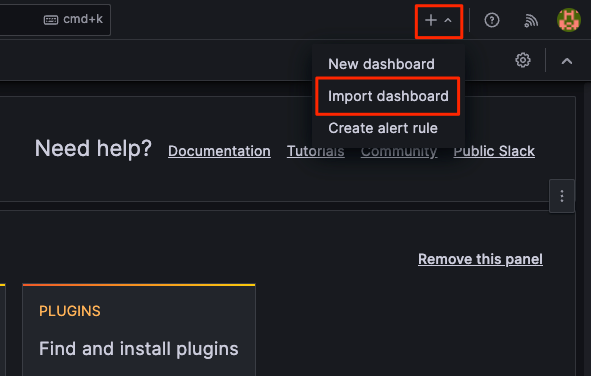
2. 좌측 사이드바에서 플러스 (+) 아이콘을 클릭하고 "Import dashboard"를 선택합니다.
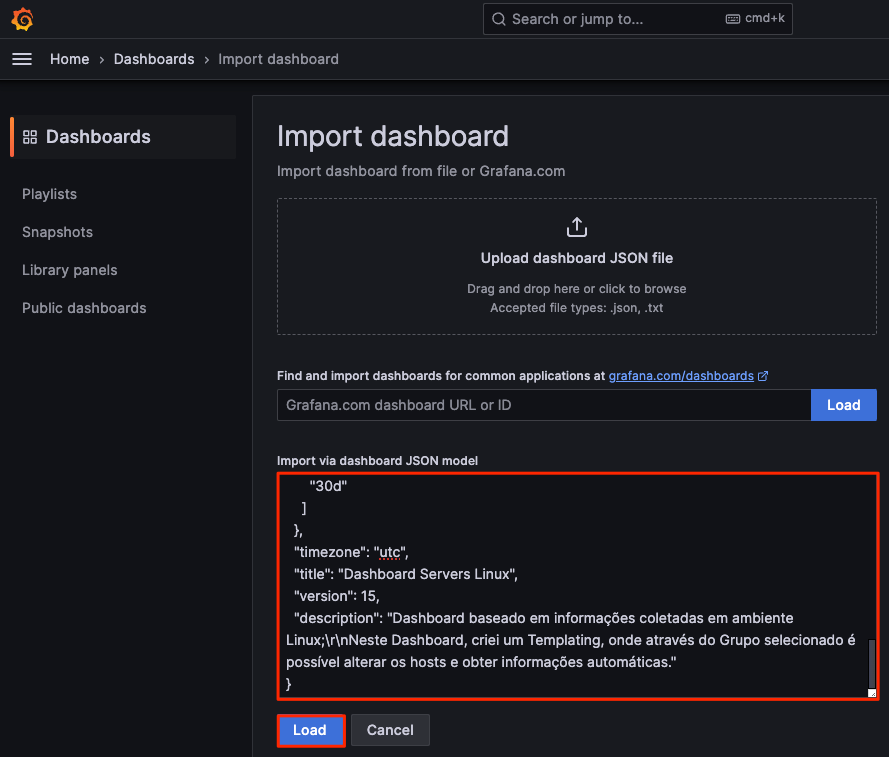
3. "Or paste JSON" 옵션을 선택하고 복사한 JSON 코드를 해당 입력란에 붙여넣습니다.
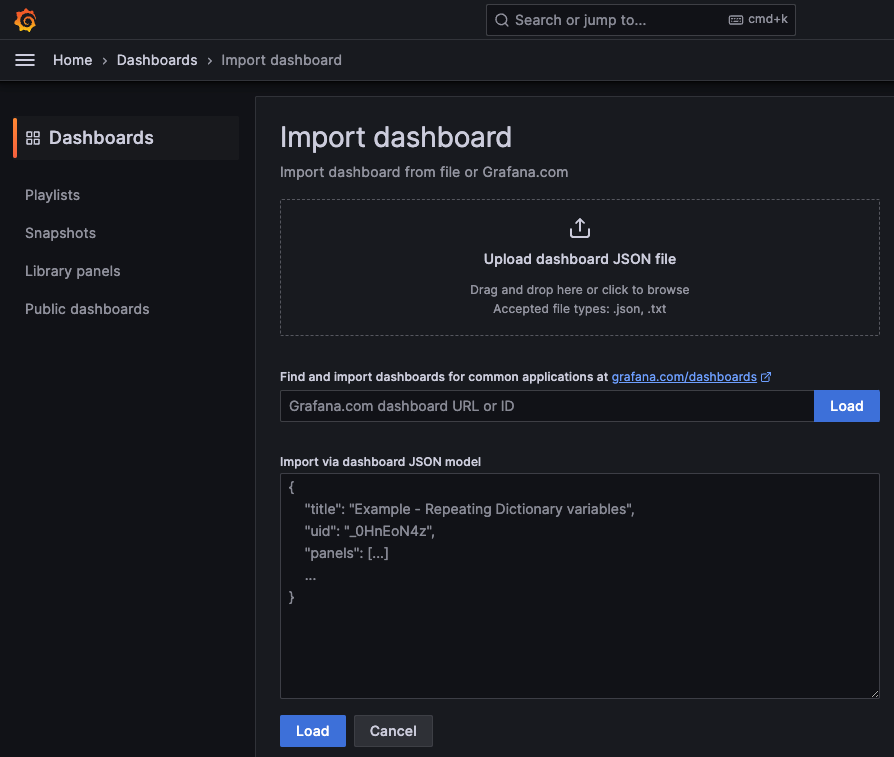
4. "Load" 버튼을 클릭하면 대시보드가 로드되고 구성할 수 있는 변수 및 데이터 소스 등을 선택할 수 있습니다.
5. 설정을 완료하고 "Import" 버튼을 클릭하여 대시보드를 저장합니다.
이제 해당 대시보드가 Grafana에 추가되었을 것입니다.
주의할 점은 대시보드를 가져올 때 사용되는 데이터 소스가 로컬에 있는 것과 호환되어야 합니다. 데이터 소스의 이름이나 설정이 변경되었다면 적절한 데이터 소스로 수정해야 합니다.
참고URL
- Grafana Labs : dashboards
728x90
'리눅스' 카테고리의 다른 글
| Telegraf 에이전트 설치(Telegraf data collector) (0) | 2023.12.05 |
|---|---|
| Nginx에서 map 디렉티브를 사용하는 방법 (0) | 2023.12.05 |
| 우분투에서 Prometheus, Grafana, 그리고 node-exporter를 설치하고 구성하는 방법 (0) | 2023.12.04 |
| 우분투에서 Grafana, InfluxDB 2, Telegraf를 설치하고 구성하는 방법 (0) | 2023.12.04 |
| 우분투에서 lsyncd를 사용하여 디렉토리 간에 변경 사항을 실시간으로 동기화하는 방법 (0) | 2023.12.01 |


