728x90
원도우에서 tcping을 사용하는 방법
TCP 포트의 가용성을 확인하기 위한 유용한 도구입니다.
tcping.exe - ping over a tcp connection
tcping 설치
tcping 다운로드 URL
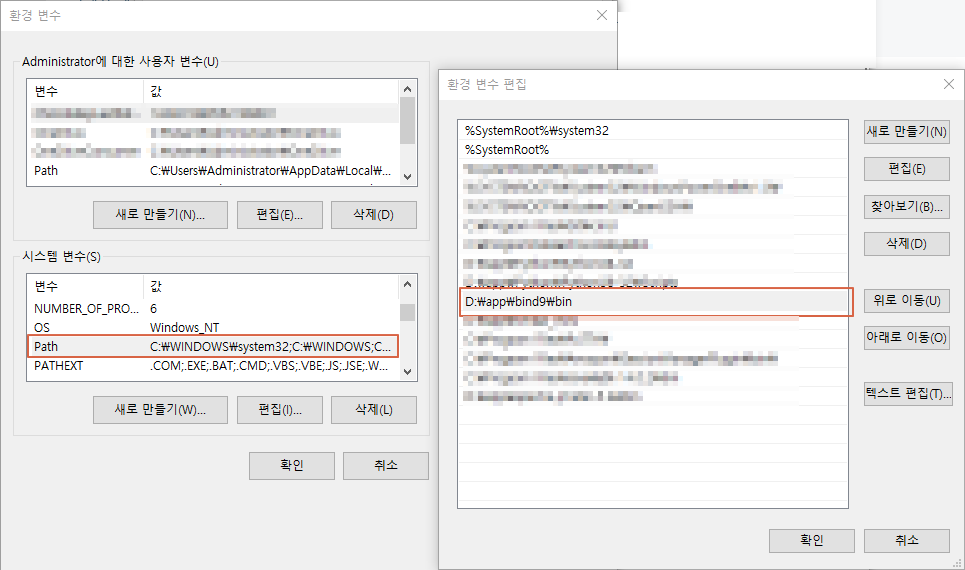
다운로드 위치 : D:\app\bind9\bin

환경 변수 : Path 설정
tcping 명령어 사용
tcping -h sangchul.krC:\Users\Administrator>tcping -h sangchul.kr
** Requesting from sangchul.kr:
(for various reasons, kbit/s is an approximation)
Probing 27.0.236.139:80/tcp - HTTP is open - time=25.212ms rcv_time=4.645 status=302 bytes=118 kbit/s=~203.247
Probing 27.0.236.139:80/tcp - HTTP is open - time=22.704ms rcv_time=3.617 status=302 bytes=118 kbit/s=~261.019
Probing 27.0.236.139:80/tcp - HTTP is open - time=23.767ms rcv_time=3.614 status=302 bytes=118 kbit/s=~261.199
Probing 27.0.236.139:80/tcp - HTTP is open - time=24.021ms rcv_time=4.340 status=302 bytes=118 kbit/s=~217.496
Ping statistics for 27.0.236.139:80
4 probes sent.
4 successful, 0 failed. (0.00% fail)
Approximate trip times in milli-seconds:
Minimum = 22.704ms, Maximum = 25.212ms, Average = 23.926ms
Approximate download times in milli-seconds:
Minimum = 3.614ms, Maximum = 4.645ms, Average = 4.054ms
C:\Users\Administrator>tcping -d -t 1.1.1.1 7777C:\Users\Administrator>tcping -d -t 1.1.1.1 7777
** Pinging continuously. Press control-c to stop **
2021:06:01 15:48:36 Probing 1.1.1.1:7777/tcp - No response - time=2009.060ms
2021:06:01 15:48:38 Probing 1.1.1.1:7777/tcp - No response - time=2011.882ms
2021:06:01 15:48:40 Probing 1.1.1.1:7777/tcp - No response - time=2015.053ms
2021:06:01 15:48:42 Probing 1.1.1.1:7777/tcp - No response - time=2007.692ms
2021:06:01 15:48:56 Control-C
Probing 1.1.1.1:7777/tcp - No response - time=573.739ms
Ping statistics for 1.1.1.1:7777
11 probes sent.
0 successful, 11 failed. (100.00% fail)
Was unable to connect, cannot provide trip statistics.
C:\Users\Administrator>tcping 명령어 옵션
C:\Users\Administrator>tcping /? | more

--------------------------------------------------------------
tcping.exe by Eli Fulkerson
Please see http://www.elifulkerson.com/projects/ for updates.
--------------------------------------------------------------

Usage: tcping [-flags] server-address [server-port]

Usage (full): tcping [-t] [-d] [-i interval] [-n times] [-w ms] [-b n] [-r times] [-s] [-v] [-j] [-js size] [-4] [-6] [-c] [-g count] [-S source_address] [--file] [--tee filename] [-h] [-u] [--post] [--head] [--proxy-port port] [--proxy-server server] [--proxy-credentials username:password] [-f] server-address [server-port]

-t : ping continuously until stopped via control-c
-n 5 : for instance, send 5 pings
-i 5 : for instance, ping every 5 seconds
-w 0.5 : for instance, wait 0.5 seconds for a response
-d : include date and time on each line
-b 1 : enable beeps (1 for on-down, 2 for on-up,
                   3 for on-change, 4 for always)
-r 5 : for instance, relookup the hostname every 5 pings
-s : automatically exit on a successful ping
-v : print version and exit
-j : include jitter, using default rolling average
-js 5 : include jitter, with a rolling average size of (for instance) 5.
--tee : mirror output to a filename specified after '--tee'
--append : Append to the --tee filename rather than overwriting it
-4 : prefer ipv4
-6 : prefer ipv6
-c : only show an output line on changed state
--file : treat the "server-address" as a filename instead, loop through file line by line
        Note: --file is incompatible with options such as -j and -c as it is looping through different targets
        Optionally accepts server-port. For example, "example.org 443" is valid.
        Alternately, use -p to force a port at command line for everything in the file.
-g 5 : for instance, give up if we fail 5 times in a row
-S _X_ : Specify source address _X_. Source must be a valid IP for the client computer.
-p _X_ : Alternate method to specify port
--fqdn : Print domain name on each line if available
--ansi : Use ANSI color sequences (cygwin)
--color: Use Windows color sequences

HTTP Options:
-h : HTTP mode (use url without http:// for server-address)
-u : include target URL on each line
--post : use POST rather than GET (may avoid caching)
--head : use HEAD rather than GET
--proxy-server : specify a proxy server
--proxy-port : specify a proxy port
--proxy-credentials : specify 'Proxy-Authorization: Basic' header in format username:password

Debug Options:
-f : force tcping to send at least one byte
--header : include a header with original args and date. Implied if using --tee.
--block : use a 'blocking' socket to connect. This prevents -w from working and uses the
        default timeout (as long as 20 seconds in my case). However it can detect an actively
        refused connection vs a timeout.

      If you don't pass server-port, it defaults to 80.

C:\Users\Administrator>
CMD 창에서 실행
echo %time% tcping 111.111.111.111 7777>echo %time% tcping 111.111.111.111 7777
11:46:31.81 tcping 111.111.111.111 7777
tcping을 사용하면 특정 호스트와 포트의 가용성을 간편하게 확인할 수 있습니다.
참고URL
- https://www.elifulkerson.com/projects/tcping.php
728x90
'원도우' 카테고리의 다른 글
| [WIP] 원도우10 검색창 추천 기능을 비활성화하는 방법 (0) | 2026.03.05 |
|---|---|
| [WIP] 원도우10 작업표시줄 뉴스 및 관심사(날씨) 위젯 설정 방법 (0) | 2026.02.28 |
| [WIP] PEM 파일을 PPK 파일로 변환하는 방법 (0) | 2026.02.28 |
| [WIP] 원도우에서 동영상 및 음악 디렉토리를 삭제하는 방법 (0) | 2026.02.27 |
| [WIP] 원도우 11에서 글꼴을 설치하는 방법 (0) | 2026.02.26 |


